Introduction to Matplotlib 28 Jan 2019
A brief introduction to Matplotlib
“Matplotlib is a Python 2D plotting library which produces publication quality figures.”
# Import pyplot and numpy
import matplotlib.pyplot as plt
import numpy as np
# A simple plot y = x
x = np.linspace(0, 2, 100)
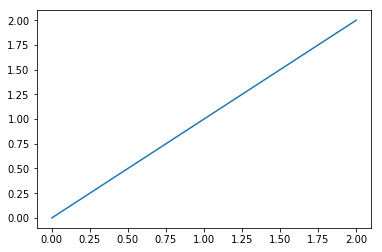
plt.plot(x, x)
[<matplotlib.lines.Line2D at 0x3a5e6a8390>]

# A simple plot with multiple lines
x = np.linspace(0, 2, 100)
plt.plot(x, x, label='linear')
plt.plot(x, x**0.5, label='square_root')
plt.plot(x, x**2, label='quadratic')
plt.plot(x, x**3, label='cubic')
plt.xlabel('x label')
plt.ylabel('y label')

plt.title("Simple Plot")

plt.legend()

plt.show()

Intro to pyplot
# Basic plot
import matplotlib.pyplot as plt
plt.plot([10, 30, 20, 40, 30, 50])
plt.ylabel('some numbers')
plt.show()

# Basic plot with x values
plt.plot([11, 12, 13, 14, 15, 16], [10, 30, 20, 40, 30, 50])
plt.show()

# Format the style of a plot
plt.plot([11, 12, 13, 14, 15, 16], [10, 30, 20, 40, 30, 50], 'bx')
plt.axis([10, 20, 0, 100]) # [xmin, xmax, ymin, ymax]
plt.show()

# Plot many datasets
t = np.arange(0., 5., 0.2)
# red line, yellow squares, green triangles and blue dashes
plt.plot(t, t, 'r-', t, t**2, 'ys', t, t**3, 'g^', t, t**0.5, 'b--')
plt.show()

# Control line properties
x = np.linspace(1,10, 100)
plt.plot(x, linewidth=4.0)
[<matplotlib.lines.Line2D at 0x3a5e24f908>]

# Plot with categorical variables
names = ['group_a', 'group_b', 'group_c']
values = [1, 10, 100]

plt.figure(1, figsize=(9, 3)) # wigth and height in inches

plt.subplot(1, 3, 1)  # nrows, ncols, plot_number
plt.bar(names, values)
plt.subplot(1, 3, 2)
plt.scatter(names, values)
plt.subplot(1, 3, 3)
plt.plot(names, values)
plt.suptitle('Categorical Plotting')
plt.show()

# Work with multiple subplots
def f(t):
    return np.exp(-t) * np.cos(2*np.pi*t)

t1 = np.arange(0.0, 5.0, 0.1)
t2 = np.arange(0.0, 5.0, 0.02)

plt.figure(1)
plt.subplot(2, 1, 1)
plt.plot(t1, f(t1), 'bo', t2, f(t2), 'k')

plt.subplot(2, 1, 2)
plt.plot(t2, np.cos(2*np.pi*t2), 'r--')
plt.show()

# create multiple figures by using multiple figure() calls
plt.figure(1)                # the first figure
plt.subplot(211)             # the first subplot in the first figure
plt.plot([1, 2, 3])
plt.subplot(212)             # the second subplot in the first figure
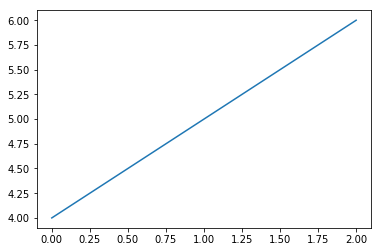
plt.plot([4, 5, 6])


plt.figure(2)                # a second figure
plt.plot([4, 5, 6])          # creates a subplot(111) by default

plt.figure(1)                # figure 1 current; subplot(212) still current
plt.subplot(211)             # make subplot(211) in figure1 current
plt.title('Easy as 1, 2, 3') # subplot 211 title
Text(0.5, 1.0, 'Easy as 1, 2, 3')


# Add Text in an arbritrary location
x = np.linspace(0,10,100)
y = 2 + 2 * x
plt.text(5, 10, r'$y = 2 + 2x $')
plt.text(5, 15, r"$\theta_0 = 2$", fontsize=14, color="r")
plt.text(5, 20, r"$\theta_1 = 0.2 \times 10^{1}$", fontsize=14, color="r")
plt.axis([0, 10, 0, 30])
plt.plot(x, y)
[<matplotlib.lines.Line2D at 0x425e7be9b0>]

# Annotate text
ax = plt.subplot(111)

t = np.arange(0.0, 5.0, 0.01)
s = np.cos(2*np.pi*t)
plt.plot(t, s, linewidth=2)

plt.annotate('local max', xy=(2, 1), xytext=(3, 1.5),
             arrowprops=dict(facecolor='black', shrink=0.05),
             )

plt.plot([2, 2], [-1.5, 1], "r--")

plt.axis([0, 6, -1.5, 2])
plt.show()

Matplotlib object-oriented interface
# Generate datasets
x = np.linspace(0, 4, 100)
y = np.sin(2*np.pi*x)
# Create Figure
fig = plt.figure()

# Add axes to the figure
# The dimensions [left, bottom, width, height] of the new axes.
# All quantities are in fractions of figure width and height.(range 0 to 1)
axes = fig.add_axes([0.1, 0.1, 0.8, 0.8])

# Plot on that set of axes
axes.plot(x, y, 'b--')
axes.set_xlabel('Set X Label') # Notice the use of set_ to begin methods
axes.set_ylabel('Set y Label')
axes.set_title('sin() function')
Text(0.5, 1.0, 'sin() function')

# Generate datasets
x = np.linspace(0, 4, 100)
y = np.sin(2*np.pi*x)

# Creates blank canvas
fig = plt.figure()

axes1 = fig.add_axes([0.1, 0.1, 0.8, 0.8]) # main axes
axes2 = fig.add_axes([0.2, 0.5, 0.4, 0.3]) # inset axes

# Larger Figure Axes 1
axes1.plot(x, x**x, 'k')
axes1.set_xlabel('X_2')
axes1.set_ylabel('x^2')
axes1.set_title('Axes 1 Title')

# Insert Figure Axes 2
axes2.plot(x, y, 'g--')
axes2.set_xlabel('X_2')
axes2.set_ylabel('sin(x)')
axes2.set_title('Axes 2 Title');

# Use subplots
fig, axes = plt.subplots()

# Use the axes object to add features
axes.plot(x, y, 'b')
axes.set_xlabel('x')
axes.set_ylabel('y')
axes.set_title('sin(x)');

# Use subplots
fig, axes = plt.subplots(nrows=1, ncols=2)
x = np.linspace(0, 4, 100)

# tight_layout automatically adjusts subplot params
# so that the subplot(s) fits in to the figure area
fig.tight_layout()

axes[0].plot(x, np.sin(2*np.pi*x), 'b')
axes[1].plot(x, np.cos(2*np.pi*x), 'r')
axes[0].set_title('sin(x)')
axes[1].set_title('cos(x)')
Text(0.5, 1.0, 'cos(x)')

# Set figure size
fig, axes = plt.subplots(figsize=(8,2))

axes.plot(x, y, 'g*')
axes.set_xlabel('x')
axes.set_ylabel('y')
axes.set_title('sin(x)');

# Save figures
fig.savefig("sin_function.png")
# Show legends
x = np.linspace(0, 2, 100)

fig = plt.figure()
ax = fig.add_axes([0,0,1,1])

ax.plot(x, x**2, label="Square x^2")
ax.plot(x, x**3, label="Cubic x^3")
ax.legend()
<matplotlib.legend.Legend at 0x3a634f96a0>

# Set the range of the axes
x = np.linspace(0, 6, 100)
fig, axes = plt.subplots(1, 3, figsize=(12, 4))

axes[0].plot(x, x**2, x, x**3)
axes[0].set_title("default axes ranges")

axes[1].plot(x, x**2, x, x**3)
axes[1].axis('tight') # Auto tight
axes[1].set_title("tight axes")

axes[2].plot(x, x**2, x, x**3)
axes[2].set_ylim([0, 60])
axes[2].set_xlim([1, 5])
axes[2].set_title("custom axes range");

Plot from a Dataframe
import pandas as pd
df = pd.DataFrame(np.random.randn(10, 4), index=list('abcdefghij'),
             columns=list('ABCD'))
df.plot(kind='scatter', x="A", y='B')
<matplotlib.axes._subplots.AxesSubplot at 0xb91b814dd8>

# Plot the histogram for each numerical value
import matplotlib.pyplot as plt
df.hist(bins=50, figsize=(20,15))
plt.show()

Samples of plots
References:
https://matplotlib.org/